¶ Creating a Pivot
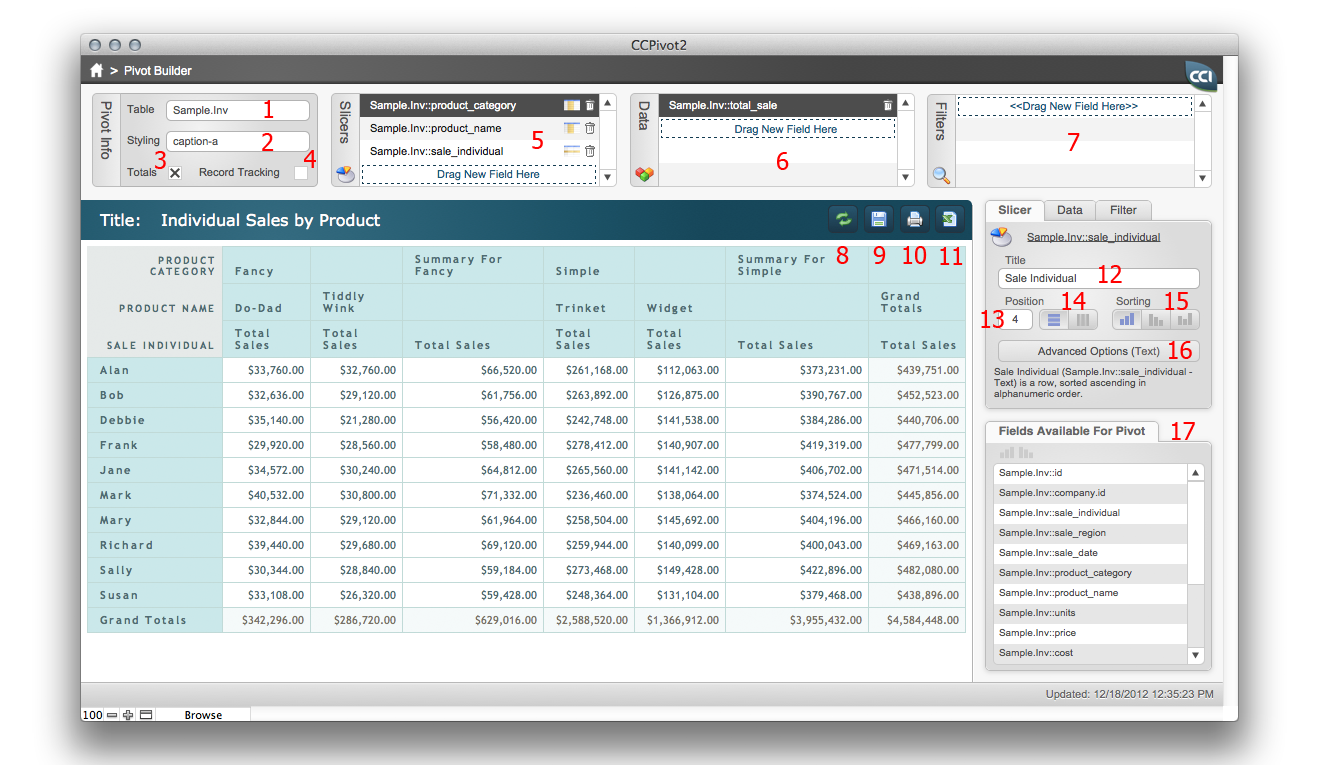
To create a pivot, the simple explanation is to click the "New" button, select your table, and fill out the info. Similarly editing a pivot is accomplished by selecting the pivot to edit and clicking the edit button. Perhaps, however, a more detailed explanation would be helpful
¶ Explaining the features and functions of CC Pivot
All of the functions of a pivot are explained below, and while we go through them in a semi-orderly fashion, they can generally be edited or entered in any order.
¶ Table
This is a simple pop-up menu with all the table occurrences you have integrated in the system. If you do not see the table occurrence in the list, you may need to go to the settings layout via the "Settings" button at the upper right corner of the home screen and click the update button on the "Layouts" tab. Selecting your data table is an important and necessary step as that will determine the context for the rest of the pivot table.
¶ Style
Another basic pop-up menu, this will determine the style of your pivot table. There are a couple things to note, however. First, unlike in the prior versions of CC Pivot you will have to refresh the pivot to see the effect of changing the style. This was done to improve speed. Second, the styles that are included by default are only meant as a starting point. You as a developer have the power to add as many styles as you want. This is done on the CSS & Javascript tab of the settings screes. The styles are simple cascading style sheets (CSS) and if you are unfamiliar with this form of formatting, there are many fantastic resources online to learn more.
¶ Totals
This checkbox will determine weather grand totals are generated for all data fields and slicers reported on. It is simply a toggle, however be aware that including totals can increase the time a pivot takes to generate.
¶ Record Tracking
This is a checkbox to include record tracking. This is the feature that allows you to click on a cell in the pivot table and go to a layout with the records that make up the found set determining the content of that cell. This feature requires that a ID field and layout be set for the table the pivot table is based on in the setting screen.
¶ Slicer Fields
This is simple list of the "slicers" or summarization fields that your pivot table will use. You can drag any field from the "Fields Available For Pivot" to an empty row to add it to the slicer list. Once a slicer is added or clicked on for selection, the slicer detail will be highlighted in the slicer detail section mentioned later.
¶ Data Fields
Like slicers, this is simple list of the "data" or reporting fields that your pivot table will use. You can drag any field from the "Fields Available For Pivot" to an empty row to add it to the slicer list. Once a data field is added or clicked on for selection, the detail will be highlighted in the data detail section mentioned later.
¶ Filter Fields
Filters are like a built in find for your data, You can drag any field from the data portal to the filed sell to set up a filter for that field, just like slicers and data fields Again this is simple list of the "filter" or search fields that your pivot table will use. You can drag any field from the "Fields Available For Pivot" to an empty row to add it to the filter list. Once a data field is added or clicked on for selection, the detail will be highlighted in the data detail section mentioned later.
¶ The "Update" button
Whenever you change any of the detail of the pivot table, you will need to update your pivot table to display the changes. There are two sorts of update that the button could perform, either a display update or a data and display update. We will attempt to determine the correct one for you when you click the button. If you have only changed settings that would affect the display of the pivot table, like the format of a data field for example, then we will only re-calculate the format portion of the pivot table. We will not go and fetch the data over again first. However if you change the data level settings, like adding a field or a filter, then we will fetch the data again before re-drawing the pivot table. If you ever want to update both the data and the display in spite of what the system believes needs done, just hold down the "Shift" key when clicking the update button.
¶ The "Save" button
This button saves your pivot and stores the current pivot report under the name entered in the title to the right.
¶ The "Print" button
The "Print" button will open the pivot table in your default browser for printing. Since we are using a web data viewer to display the pivot table, this is the most straightforward way of printing. This also let's us provide the pivot table in a standard HTML table, which means you can easily take the pivot table from your browser and copy and paste it into any other tool like Excel, for further editing.
¶ The "Excel" button
We have a simple button that you can use to export your pivot to Excel. Simply click this button on the bottom bar and type the name of the file you want to create. Click Ok and an excel file will be created on your desktop.